
For the Region of Durham's Simcoe Street Cable Car Feasibility Study, I developed a publication system and visual language for a technical report exploring aerial cable car technology as a potential transit solution. Working from the established Simcoe Street Rapid Transit branding, I adapted the color system and developed custom graphics, diagrams, layouts, and accessible document formatting to help make complex transportation concepts approachable for a public audience. With approximately 32 hours budgeted for the entire project, the work required a fast, focused design process from initial branding through final publication.
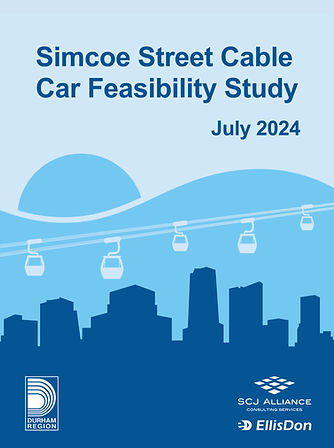
Simcoe Street Cable Car Feasibility Study
Role: Graphic Designer
Scope: Publication Design • Information Design • Accessibility • Visual Systems
What I Contributed: Publication design • Visual identity • Information design • Technical illustration • Accessible document design • Data visualization
Refining
the Brand
Building from the established Simcoe Street Rapid Transit branding, I developed a streamlined visual system around its existing colors and a simplified cable-car graphic language. The system combined bold section openers, consistent typography, and recurring graphic elements to give a highly technical report a cohesive and approachable visual identity. This was also one of my first fully accessible documents, requiring me to adapt my production workflow to stricter Canadian accessibility standards and learn new approaches to accessible document formatting along the way.


Bringing It Together
The final study brought the visual system into a publication designed to balance technical detail with readability. I developed page layouts, section graphics, diagrams, tables, and supporting visuals that organized complex engineering and transportation content without overwhelming the reader. With roughly half of the project's limited production time dedicated to the final study itself, the established visual system became an important production tool—allowing new pages and graphics to come together quickly while maintaining consistency throughout the report.
Visualizing the Data
The technical nature of the study created plenty of opportunities for custom information graphics. I translated system configurations, station requirements, travel times, development scenarios, and clearance requirements into diagrams and visual comparisons that made specialized concepts easier to understand at a glance.
These graphics also gave the publication some of its personality, using illustration, color, and simplified forms to make an unfamiliar transit technology feel more approachable.


